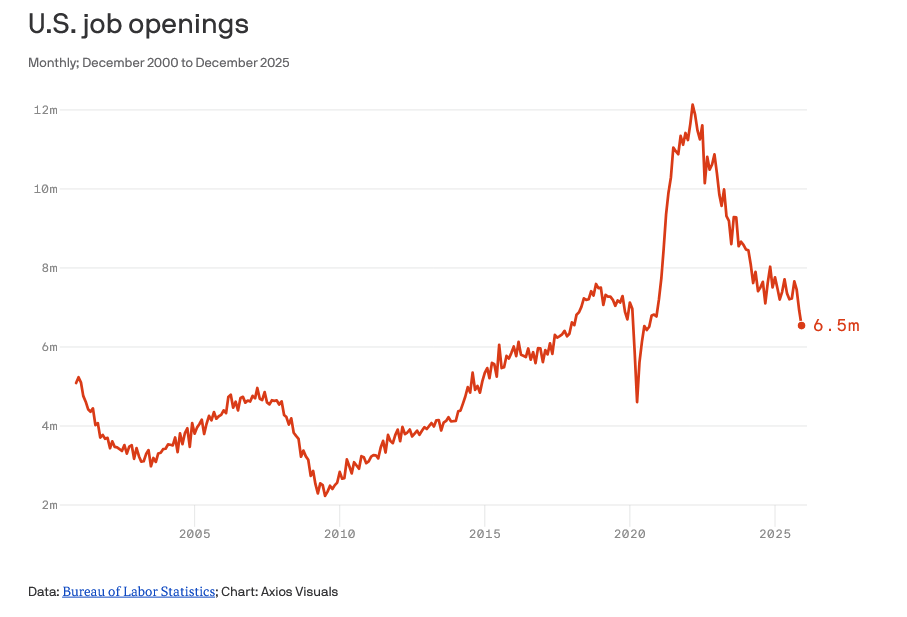
The jobs market is starting to show hard-to-ignore cracks – https://www.axios.com/2026/02/05/jolts-data-december-jobs-market
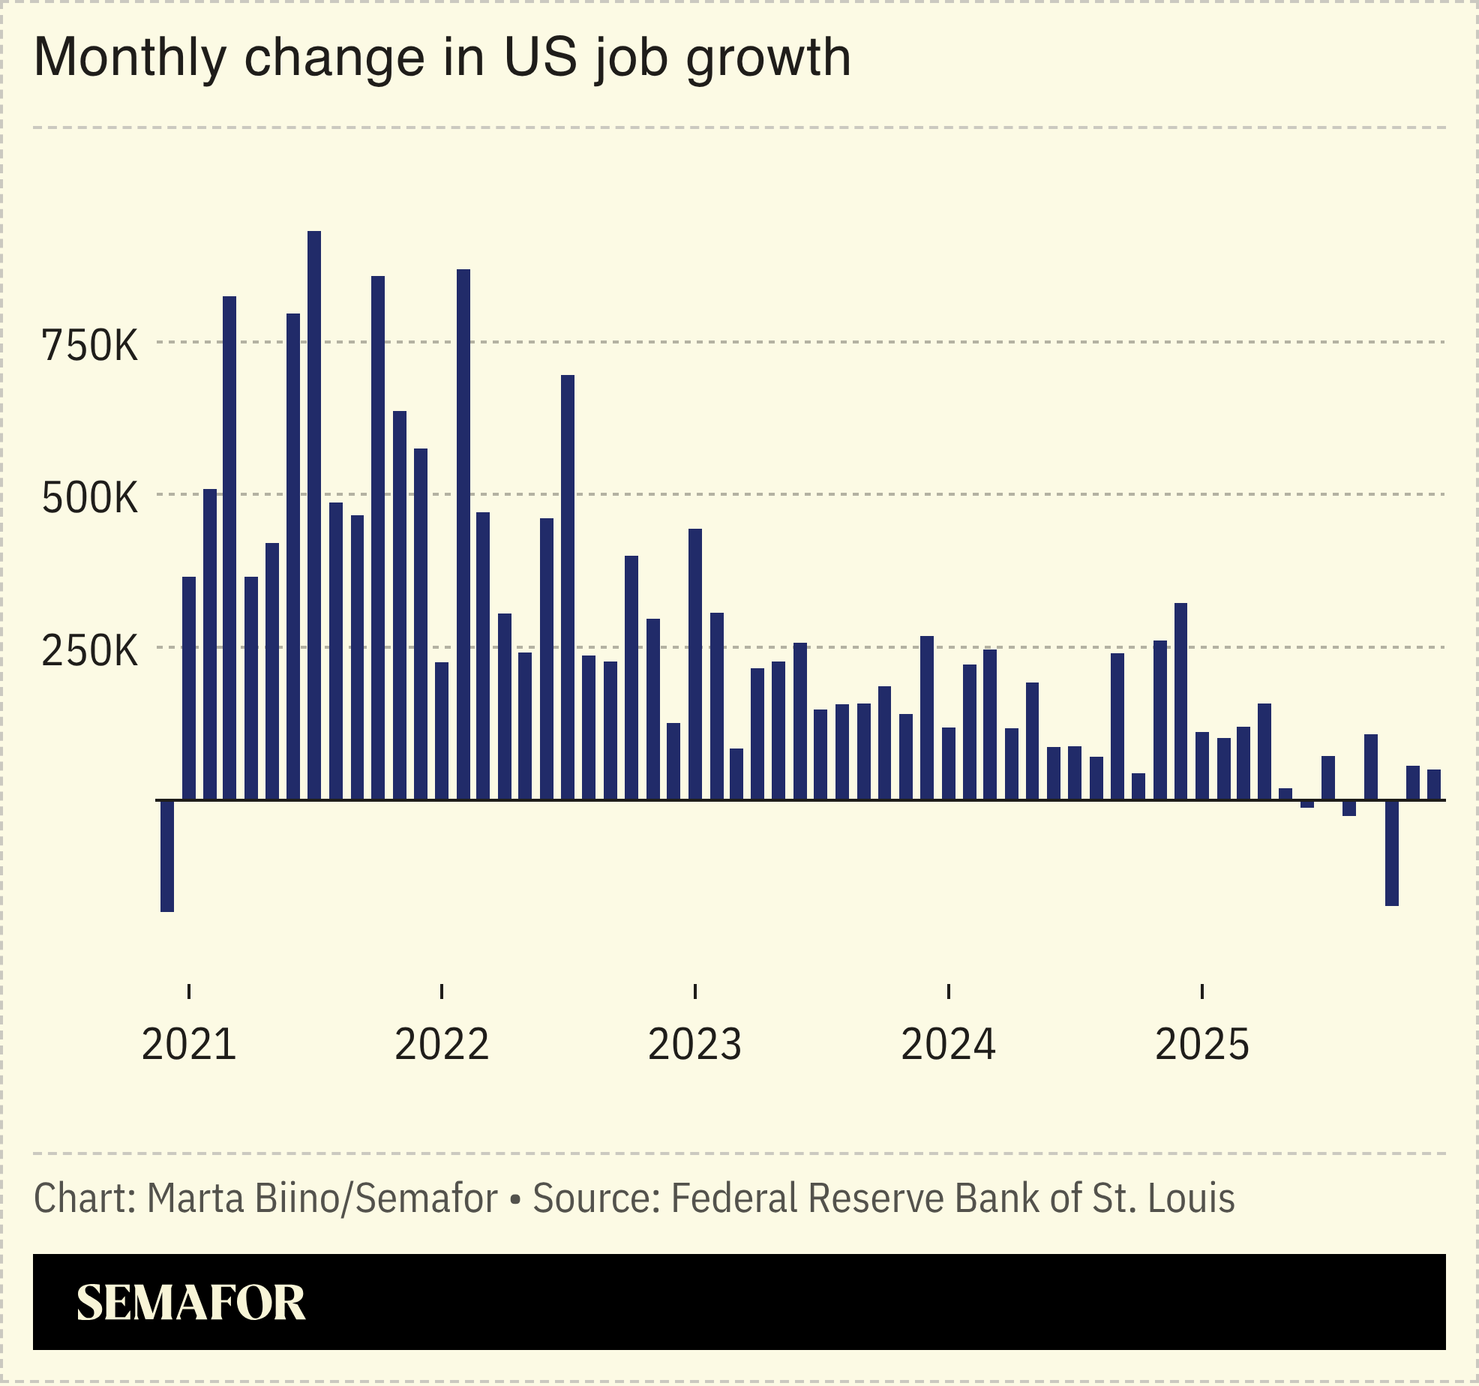
US employers cut more jobs last month than in any period since 2009. More than 100,000 workers were fired at Amazon, UPS, and Dow, and hiring was the slowest for any January on record, according to outplacement firm Challenger, Gray & Christmas. The low-fire, low-hire dynamic that has kept the US labor market in an anxious balance appears to have tipped. US layoffs in January hit highest monthly record since 2009 – https://www.semafor.com/article/02/05/2026/us-layoffs-in-january-hit-highest-monthly-record-since-2009
Yikes.


You must be logged in to post a comment.