Scary Charts 12.01.24

Office CMBS Delinquency Rate Spikes to 10.4%, Just Below Worst of Financial Crisis Meltdown. Fastest 2-Year Spike Everhttps://wolfstreet.com/2024/11/30/office-cmbs-delinquency-rate-spikes-to-10-4-just-below-worst-of-financial-crisis-cre-meltdown-fastest-2-year-spike-ever/

Yikes.

The world’s worst countries for binge-drinking https://www.statista.com/chart/5357/the-worlds-worst-countries-for-binge-drinking/

Yikes.

Which Lifestyle Changes Can Make You Live Longer?https://www.statista.com/chart/31766/reduction-in-the-risk-of-premature-death-after-age-40-when-sticking-to-the-lifestyle-factors/

Yikes.

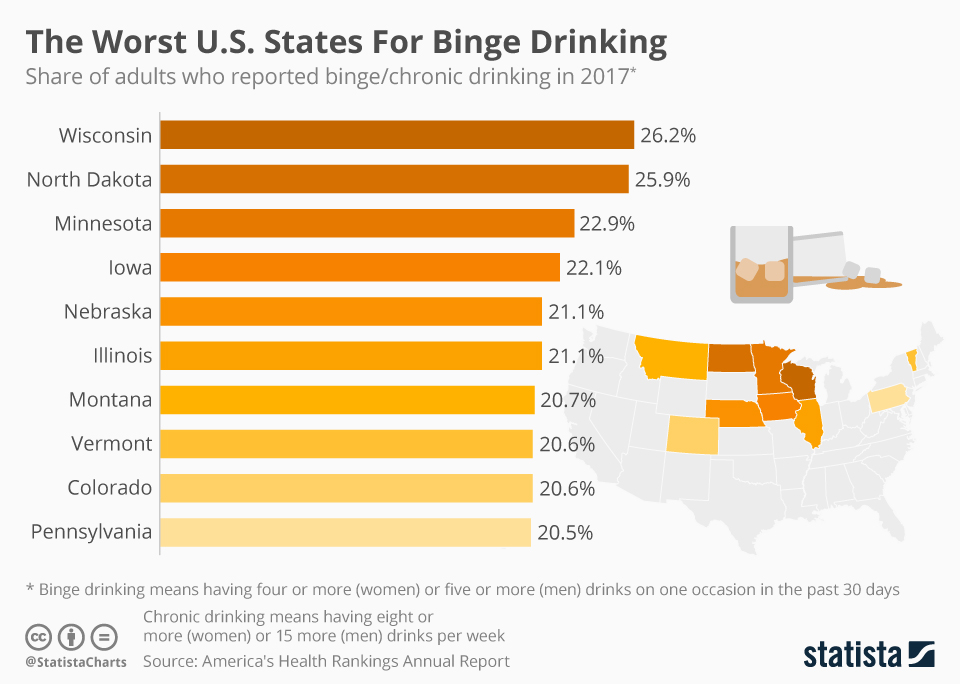
The Worst U.S. States For Binge Drinkinghttps://www.statista.com/chart/12345/the-worst-us-states-for-binge-drinking/

Yikes. But a great day for Scary Charts!

Trends in Binge Drinking

The study included 18,794 adults aged 65 years and older who participated in the 2015-2019 National Survey on Drug Use and Health. Binge drinking was defined as consuming 5 or more drinks on the same occasion for men and 4 or more drinks for women. Binge drinking among older men increased from 12.8% in 2015 to 15.7% in 2019 but remained stable among older women (7.6% to 7.3%). Having a college degree was associated with a higher risk of binge drinking among women but a lower risk among men. Men who were separated or divorced were also at higher risk, but women were not. Both men and women who reported use of tobacco or cannabis in the past month were at higher risks of binge drinking.

Wiley. “Trends in binge drinking among older men and women in the United States.” ScienceDaily. http://www.sciencedaily.com/releases/2021/12/211208090023.htm (accessed December 8, 2021).

Binge Drinking – the MMWR Version

Sociodemographic Differences in Binge Drinking Among Adults — 14 States, 2004

I like the Medpage article title better but the details in the original MMWR summary are a lot better.  For example:

However, after adjusting for sex and age, the highest average number of binge drinking episodes during the preceding 30 days was reported by binge drinkers whose household income was <$25,000. (4.9), and the highest average number of drinks per binge episode was reported by non-Hispanic blacks (8.4) and Hispanics (8.1).

Know your sources, read widely, and don’t make broad assumptions from titles.