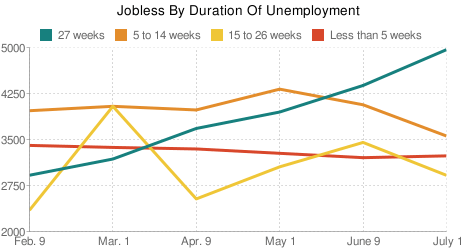
The scary line is the bluish one trending upwards.
Job Searches Taking Longer – Planet Money Blog : NPR

The scary line is the bluish one trending upwards.
Job Searches Taking Longer – Planet Money Blog : NPR
EconomPic: “Japanese Wages in Record Plunge”

This is what happens to the people who make the stuff we used to buy.
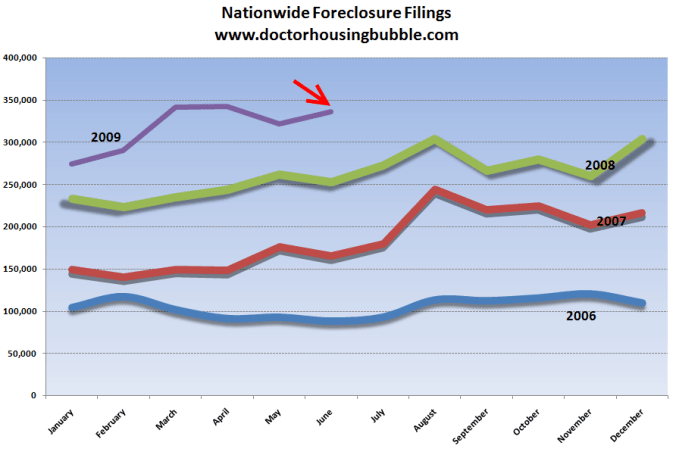
Underwriters need to pay attention to statistics like these for financial underwriting purposes
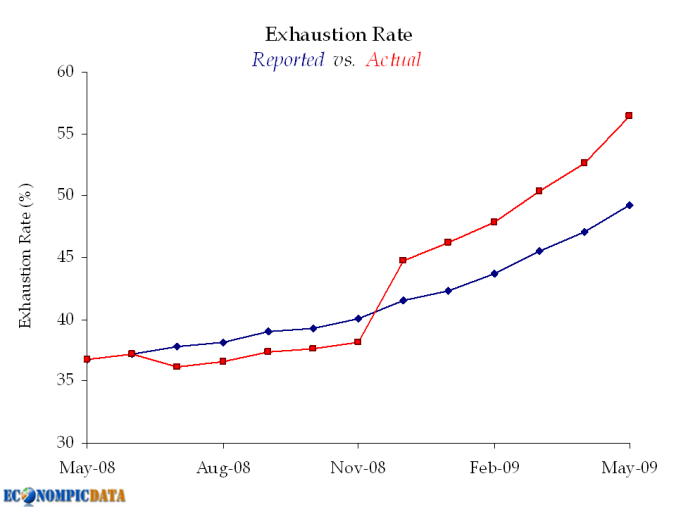
Having fun with numbers.
EconomPic: The “Exhaustion Rate” Underestimates the Issue
Read this blog article to gain a deeper understanding of how bad things really are.
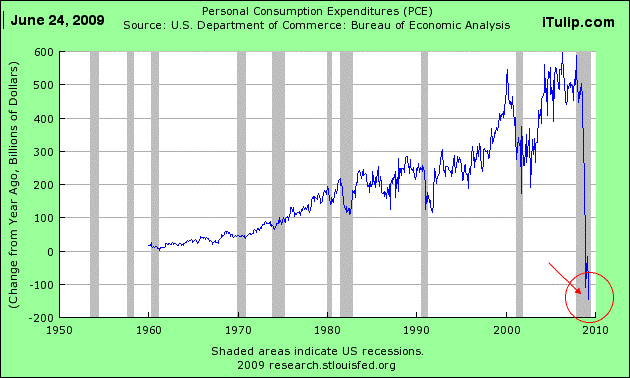
Let's all stop shopping at the same time
Since the Great Crash of 2009 I’ve often wondered if we are experiencing a run of the mill type of recession or something else. I’ve also thought a lot about large scale fundamental shifts in behavior, like if everyone stopped shopping at the same time. Now I think about whether or not consumer behavior has permanently changed?
If the answer to this is yes…
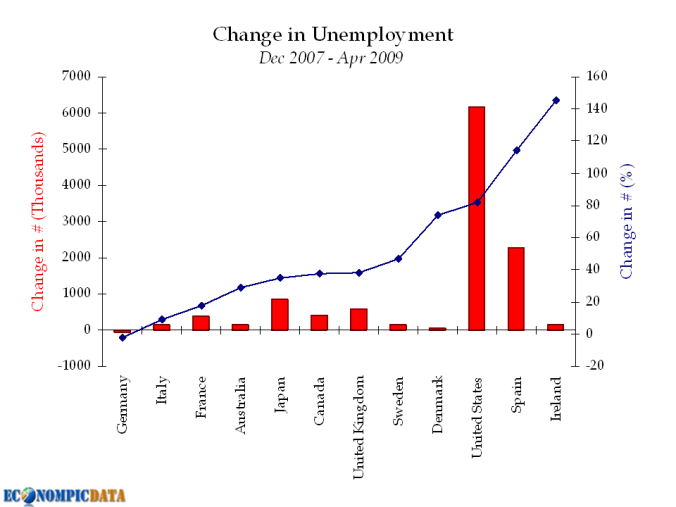
Distrubing Chart
EconomPic: Global Unemployment to Rise to 1970’s Levels
Does anyone else besides me find this chart to be really disturbing?


You must be logged in to post a comment.