Lost Decade for American Income – WSJ.com
For your Scary Charts check out the article link below.
Or see what Yves Smith is writing about real estate.
Lost Decade for American Income – WSJ.com
For your Scary Charts check out the article link below.
Or see what Yves Smith is writing about real estate.
EconomPic: Productivity Down… Is this Finally the Employment Bottom?
Click through and read the article. There is an interesting series of charts on productivity.
This chart may not be as scary as you might think.
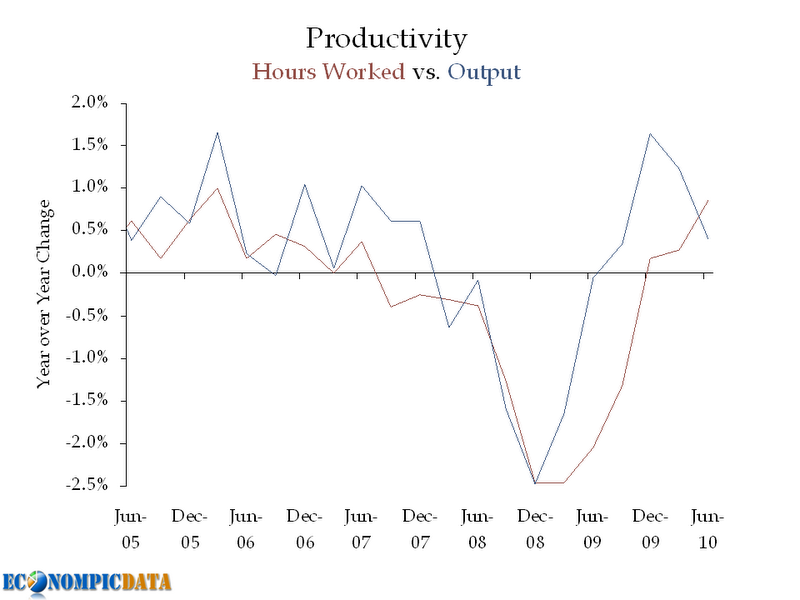
Scary or Not Scary?
Worst Home Sales Numbers Ever « naked capitalism
If you are not a regular reader of Yves Smith, you should be.
On Turning a Mountain Into a Molehill | Credit Writedowns
Readers of my Scary Charts posts will note that sometimes you’ll find a chart with a link to the original article while other times you’ll find just the link.
If all you see is a link, I encourage you to read the original article.
You gotta read this one.

Calculated Risk: Restaurant Index shows Expansion in March
This is the first time in 29 months that the index is showing expansion.




You must be logged in to post a comment.