More archipods = less demand for office space too.
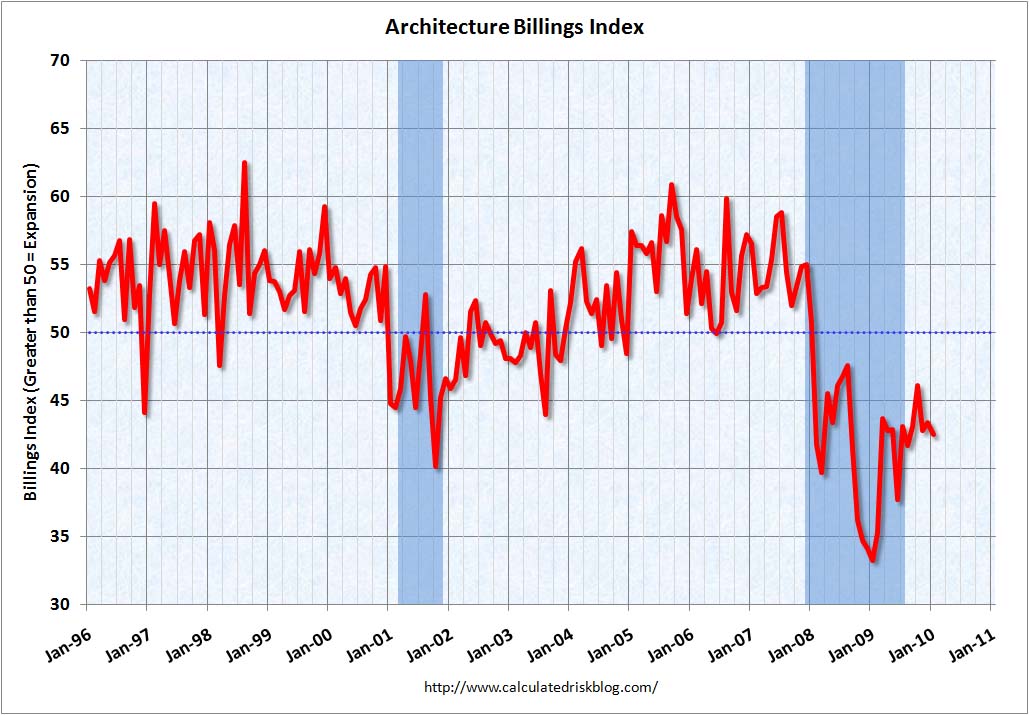
Calculated Risk: AIA: Architecture Billings Index Shows Contraction in January

More archipods = less demand for office space too.
Calculated Risk: AIA: Architecture Billings Index Shows Contraction in January
Chart courtesy of:

Recovery?
So, How Do You Think This Movie Will End?
The two charts you’ll discover through this link were so scary I was unable to copy and insert into this post.
The Big Picture » Blog Archive » Employment Charts
The scariest chart is the Nonfarm Payrolls Decade Gains 1940-2009.
Chart of the Day – Lowest decade job growth on record

I really, really love charts. The truth is in the facts.
Calculated Risk: Employment-Population Ratio, Part Time Workers, Temporary Workers

Looks like the last one.
Calculated Risk: Unemployed over 26 Weeks, Diffusion Index, Seasonal Retail Hiring

I love charts. Unfortunately the news is still bad.
Ugly CRE charts | Analysis & Opinion | Reuters

These charts are not scary. They are ugly.
A hat tip to Michael Panzner and his blog post of 1/6/2010 at Financial Armageddon for directing me to these charts.
I love charts.
EconomPic: ADP Jobs Down 84,000; Services Jobs Grow
If you click through to the original post on EconomPic you will see a tiny red speck as evidence for services jobs growth. Unfortunately, the copy here does not capture that tiny red speck north of the line.

Some might call this good news (see the tiny red blip upper right corner)


You must be logged in to post a comment.