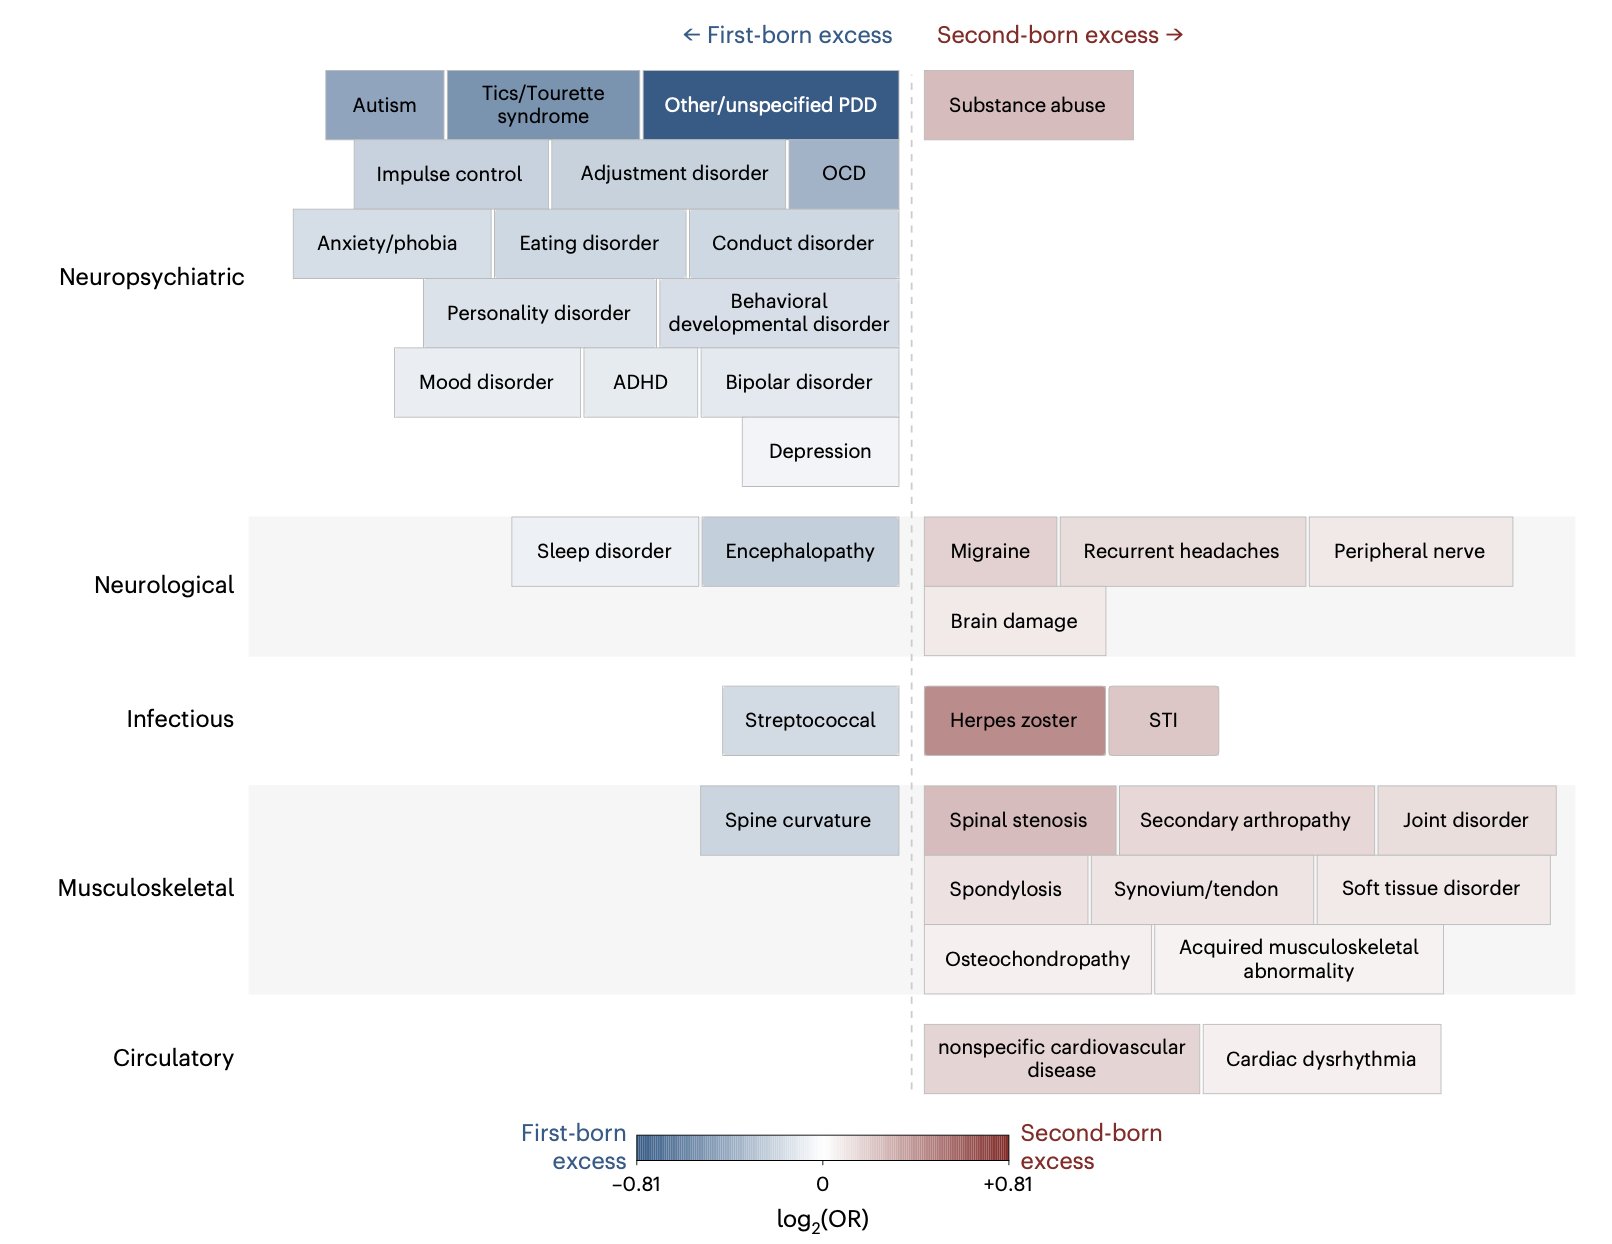
A Striking Concentration of First-born Excess in Neuropsychiatric Conditions – Scary Charts 08.03.26

The study has a number of limitations and…

This study was supported by award no. 1R01MH137646-01 from the National Institute of Mental Health and the National Institutes of Health to S.A.K. and A.R. The funders had no role in study design, data collection or analysis, decision to publish or preparation of the manuscript. Birth order and disease risk across the human phenome – https://www.nature.com/articles/s44360-026-00177-z#Abs1

I’m a first-born.

YIKES.

Scary Charts (Prescription Drug edition) – 08.02.26

Today, three PBMs, CVS Caremark (34% market share), Express Scripts (23%, owned by Cigna’s Evernorth), and Optum Rx (22%, owned by UnitedHealth Group), control nearly 80% of all U.S. prescription claims. In exchange for placing a manufacturer’s drug on the formulary, or giving it preferred status over competing therapies, the PBM negotiates rebates, administrative fees, and performance payments from the manufacturer. A portion of those payments flows back to the health plan, while the PBM retains part of the negotiated revenue.

One feature of today’s market that surprises many people is how vertically integrated it has become. The largest PBMs are no longer independent middlemen. They sit inside healthcare conglomerates that also own insurers, pharmacies, physician groups, specialty pharmacies, and mail-order pharmacies. For example, CVS Health owns Aetna, CVS Caremark, CVS Pharmacy, MinuteClinic, and Signify Health. UnitedHealth Group owns UnitedHealthcare, Optum Rx, and Optum Health. Cigna owns Express Scripts through Evernorth. This consolidation has fueled ongoing debate about whether these organizations can optimize each part of the supply chain independently or whether incentives increasingly favor the parent company as a whole. Mark Cuban on Breaking the Drug Pricing Cartel: Inside Cost Plus Drugs – https://pearhealthcareplaybook.substack.com/p/mark-cuban-on-breaking-the-drug-pricing

Hat Tip – https://ritholtz.com/2026/08/10-sunday-reads-239/

Yikes.

Scary Charts – 07.30.26

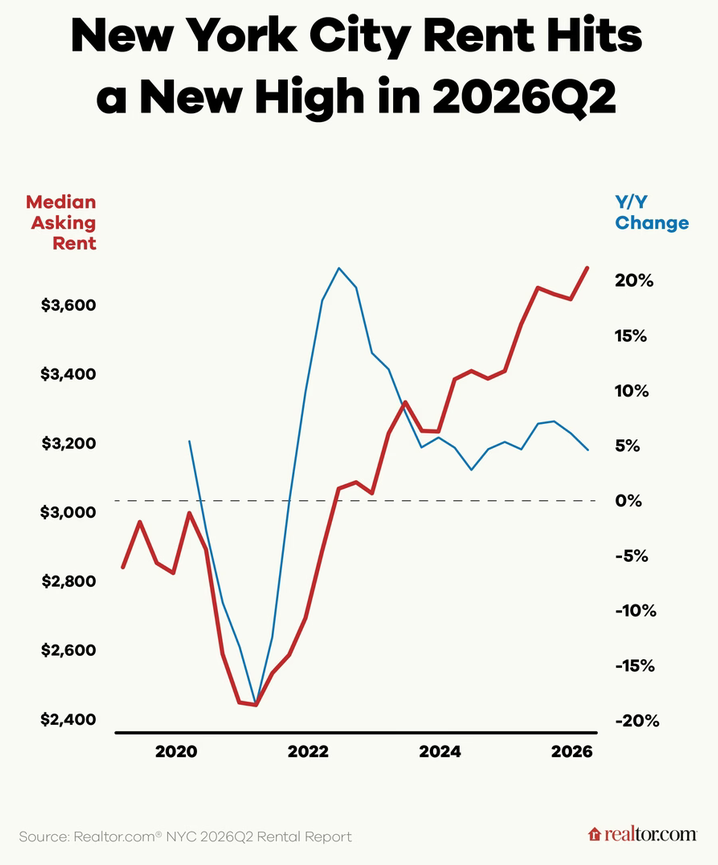
Manhattan led the city with the median asking rent jumping 9% ($427) in a single year to reach $5,117. Brooklyn recorded the second-biggest annual spike of 5.9% ($225), as the median rent rose to $4,054. Queens followed closely with rents rising 5.6% to $3,561 from last year. Fresh College Grads Face NYC’s Toughest Rental Market Yet as Asking Prices Surge to 7-Year High – https://www.realtor.com/news/trends/college-grads-toughest-rental-market-nyc-july-2026-rent-report/

Yikes.

Scary Charts – 06.28.26

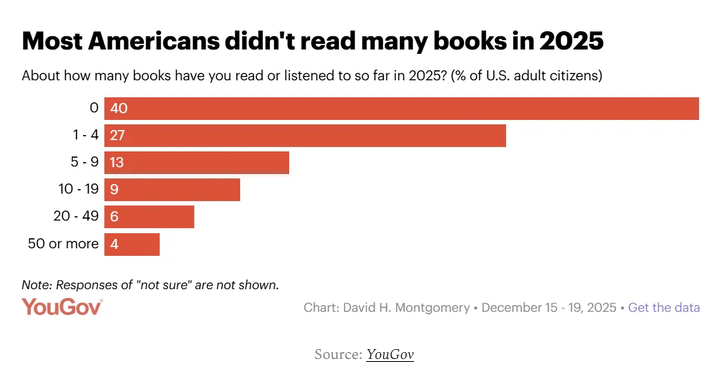
Americans of all ages now spend far more time on screens, crowding out time that might otherwise be spent with a book. This trend too shows a similar socioeconomic divergence: Specifically, adults with high school education or less are four times more likely to be smartphone-dependent (24%) than college graduates (6%). A Generational Collapse in Reading – https://www.demographyunplugged.com/p/a-generational-collapse-in-reading

Yikes.

Scary Charts 05.17.26

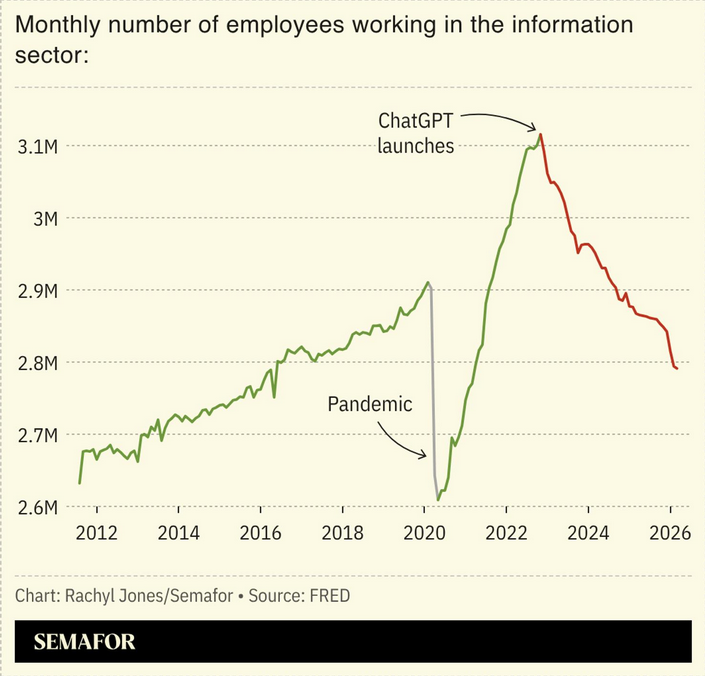
Source – The Class of 2026 is cooked https://www.semafor.com/article/05/15/2026/ai-has-contorted-the-job-market-for-twentysomethings-leaving-college-this-may

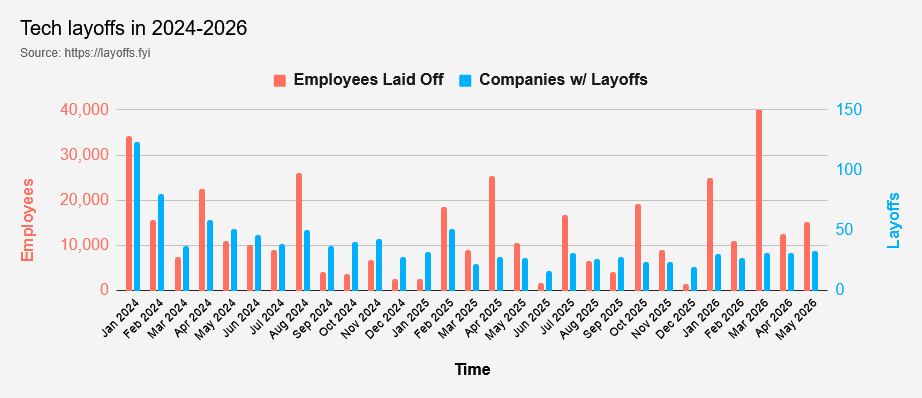
Source – https://layoffs.fyi/

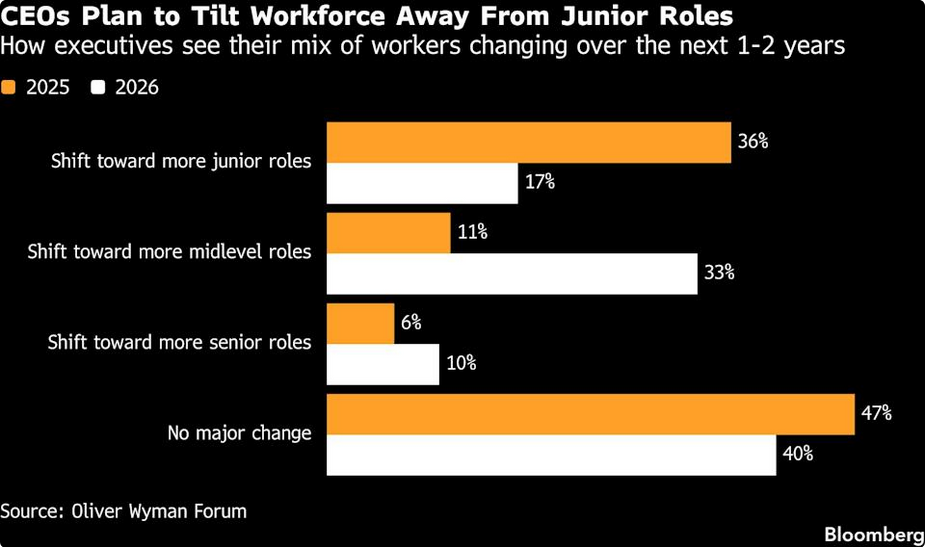
“I think the junior level is definitely finding it harder now to enter the workforce,” said John Romeo, who leads the consulting firm’s research arm, the Oliver Wyman Forum. “It’s those mid- and senior-level employees that CEOs are now looking at to drive productivity.” That’s because of the types of tasks that AI agents are able to perform, from writing code at the level of a junior developer to evaluating sales leads. What the agents can’t do in many fields is make judgment calls using the insight that comes from on-the-job experience, according to labor experts. AI Poised to Tilt Job Market Leverage Toward Older Workers – https://finance.yahoo.com/economy/policy/articles/ai-poised-tilt-job-market-150000094.html

Yikes!

If you managed to scroll down this far here’s a bonus video.

Scary Charts – 09.13.25

Interestingly, older workers (65+) earn around $3,000 more than those in the 25 to 34 bracket, reflecting a group of late-career professionals who continue to command strong wages. Charted: Median U.S. Salaries by Age Group https://www.visualcapitalist.com/charted-median-u-s-salaries-by-age-group/

Late-career professional. There seem to be a lot more of us now.

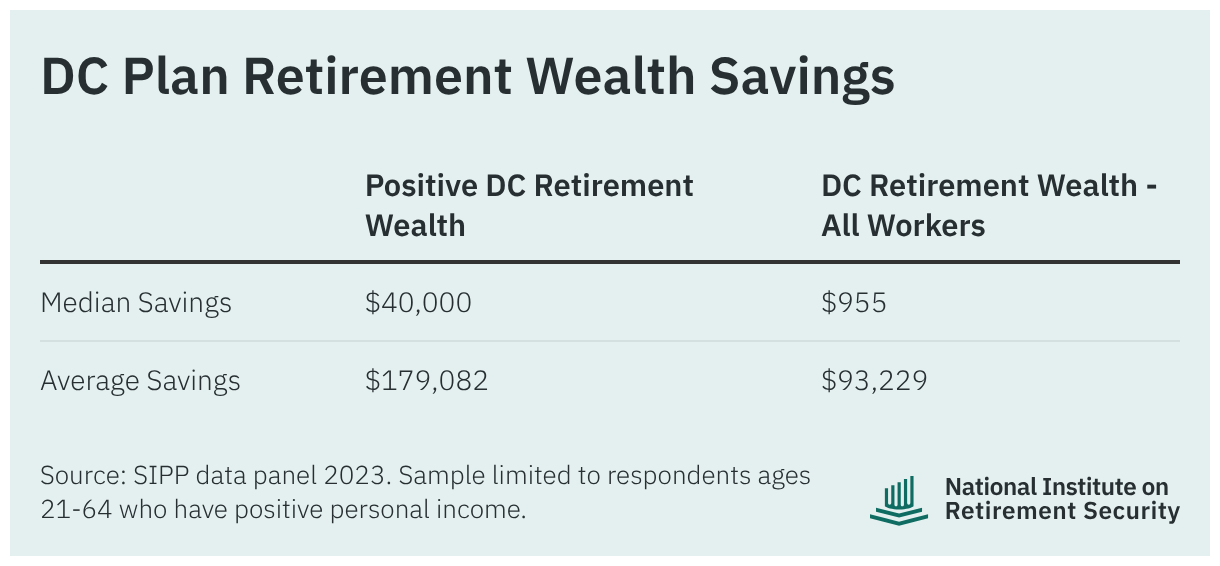
Three in four workers (75 percent) plan to work for pay in retirement, compared with just 29 percent of retirees who report they have actually worked for pay in retirement. In fact, the RCS has consistently found that workers are far more likely to plan to work for pay in retirement than retirees are to have actually done so. 2025 Retirement Confidence Survey – https://www.ebri.org/retirement/retirement-confidence-survey

But if you’re working for pay in retirement how can this be considered retirement?

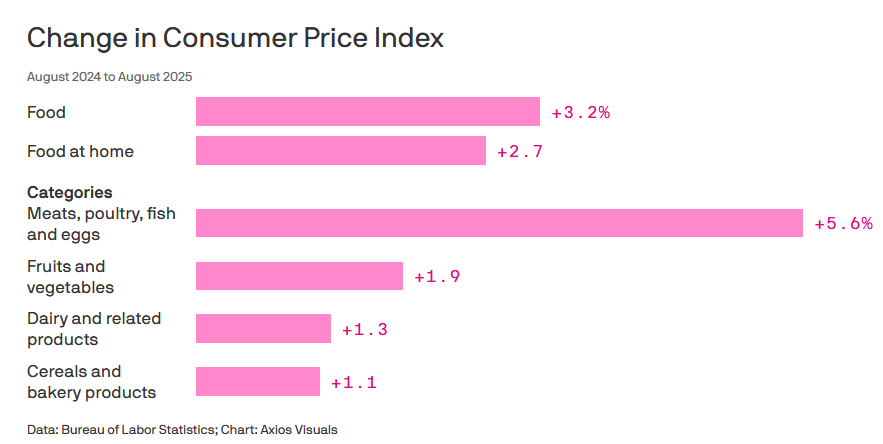
Source: https://www.axios.com/2025/09/11/trump-tariffs-grocery-prices-rise-cpi

FYI, the BLS statistics are BS. Real world eyeball prices at the market tell me so.

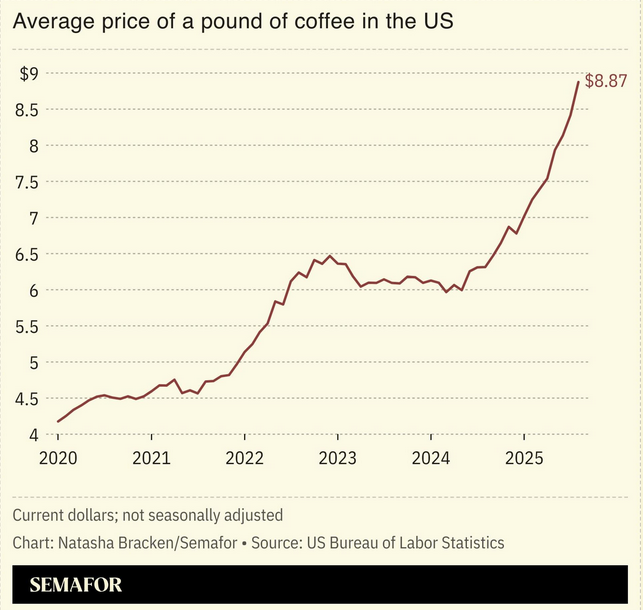
Like coffee. Coffee prices in the US has surged more than 20% in the last year.

US coffee prices surge as tariffs take effect – https://www.semafor.com/article/09/12/2025/us-coffee-prices-surge-as-tariffs-take-effect

Ooh…not just coffee.

Here’s the inflation breakdown for August 2025 — in one chart – https://www.cnbc.com/2025/09/11/inflation-breakdown-for-august-2025.html

I guess I’ll keep working in “retirement”.