
APC indicates annual percentage change. This study of alcohol-related mortality in the US suggests there has been a significantly higher rate of increase in deaths among female individuals in recent years.
Trends in Alcohol-Related Deaths by Sex in the US, 1999-2020 — http://10.1001/jamanetworkopen.2023.26346
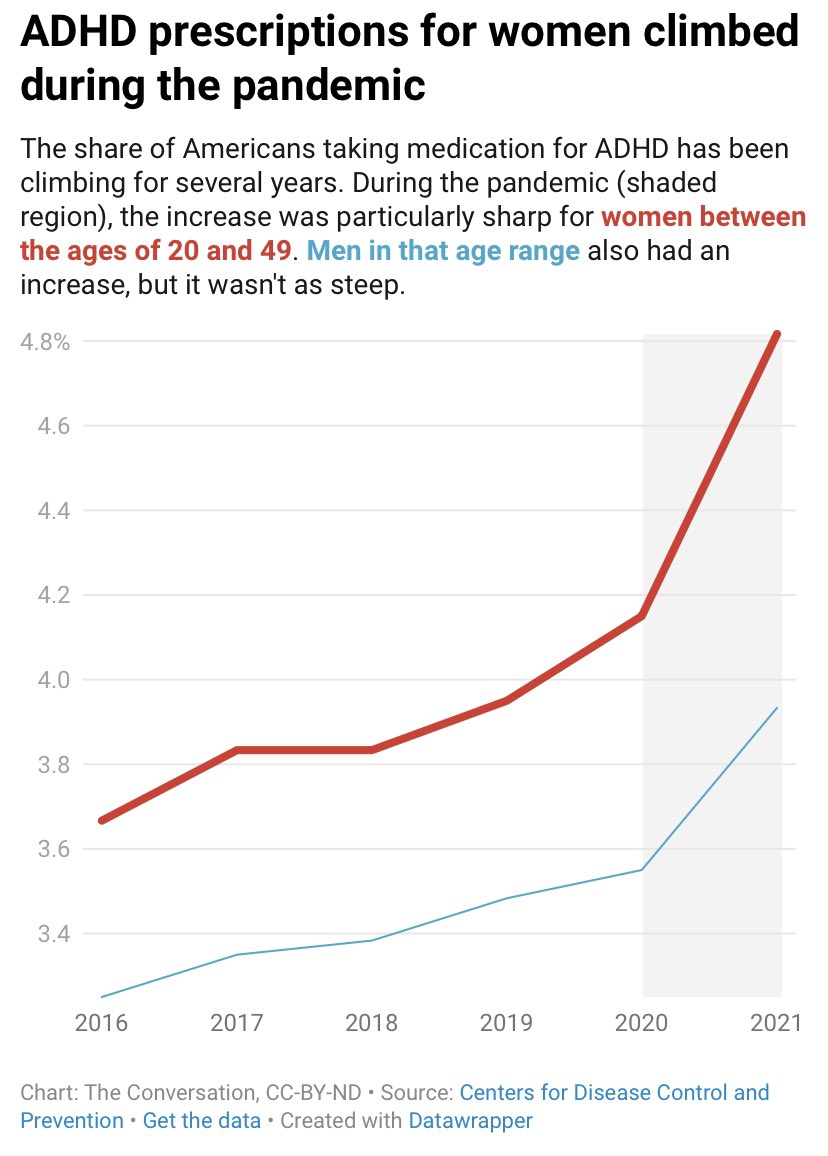
In March 2023, the U.S. Centers for Disease Control and Prevention reported an unprecedented spike in stimulant prescriptions between 2020 and 2021. Perhaps most surprising was that the demographic showing the greatest increases in stimulant use – an increase of almost 20% in one year – were in women in their 20s and 30s…
But while the internet exploded with ADHD content, researchers in Canada began sorting #ADHD TikTok videos into categories based on their accuracy and helpfulness. They reported something important: A majority of #ADHD content was misleading. Only 21% of the posts provided useful and accurate information.
More adults than ever have been seeking ADHD medications – an ADHD expert explains what could be driving the trend — https://theconversation.com/more-adults-than-ever-have-been-seeking-adhd-medications-an-adhd-expert-explains-what-could-be-driving-the-trend-206052
Alcohol AND amphetamines. Self-diagnosed ADHD. SMH.

https://www.cnn.com/2023/08/10/health/drinking-water-schools-study-wellness
I found this article interesting.
Very interesting. Thanks.