
Interestingly, older workers (65+) earn around $3,000 more than those in the 25 to 34 bracket, reflecting a group of late-career professionals who continue to command strong wages. Charted: Median U.S. Salaries by Age Group https://www.visualcapitalist.com/charted-median-u-s-salaries-by-age-group/
Late-career professional. There seem to be a lot more of us now.
Three in four workers (75 percent) plan to work for pay in retirement, compared with just 29 percent of retirees who report they have actually worked for pay in retirement. In fact, the RCS has consistently found that workers are far more likely to plan to work for pay in retirement than retirees are to have actually done so. 2025 Retirement Confidence Survey – https://www.ebri.org/retirement/retirement-confidence-survey
But if you’re working for pay in retirement how can this be considered retirement?
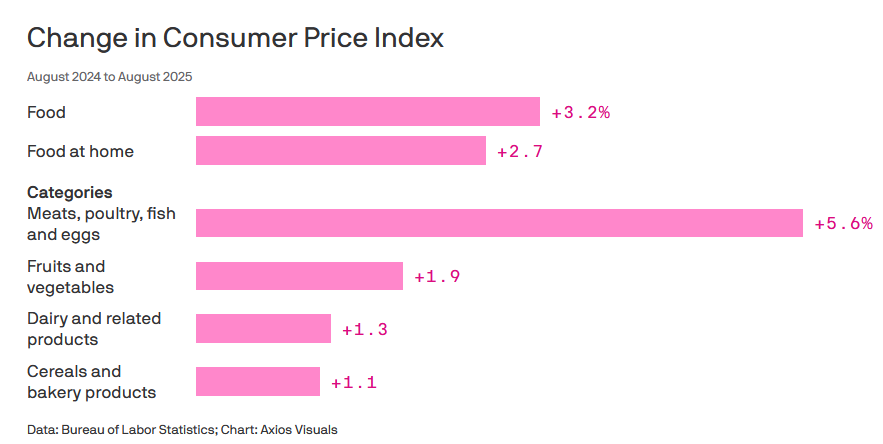
Source: https://www.axios.com/2025/09/11/trump-tariffs-grocery-prices-rise-cpi
FYI, the BLS statistics are BS. Real world eyeball prices at the market tell me so.
Like coffee. Coffee prices in the US has surged more than 20% in the last year.
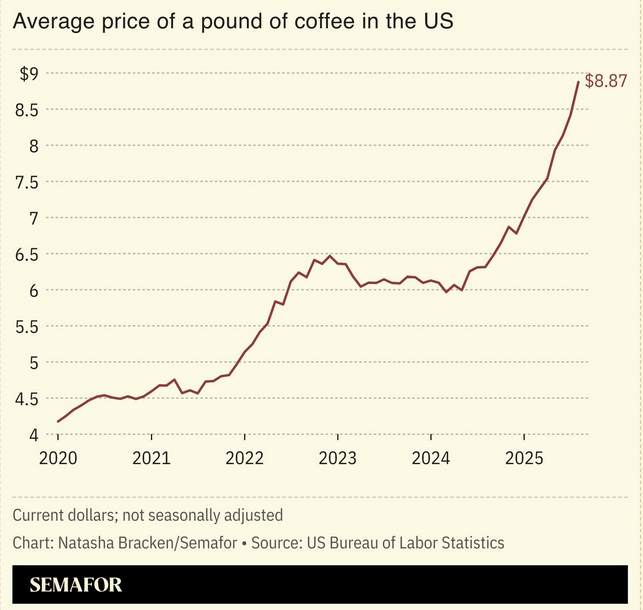
US coffee prices surge as tariffs take effect – https://www.semafor.com/article/09/12/2025/us-coffee-prices-surge-as-tariffs-take-effect
Ooh…not just coffee.

Here’s the inflation breakdown for August 2025 — in one chart – https://www.cnbc.com/2025/09/11/inflation-breakdown-for-august-2025.html
I guess I’ll keep working in “retirement”.

Have you changed your projected retirement date?
No. Still 2-4 years out.